Markov Epidemic, a stochastic model for disease outbreak
A few years ago, I had the chance to work at ENS Cachan (now ENS Paris-Saclay) on statistical inference of networks based on how information propagates on them. Back then, we used to think in terms of networks of individuals subject to diseases that spread among neighbors, but more realistic application domains were thought to be computer malwares or viral marketing online. Obviously times have changed, and with several weeks of lockdown ahead, I thought about revisiting some of this work in the light of the recent events.
This article aims to describe a simple model to simulate random disease outbreaks and provide empirical evidence of the role of the network topology. In layman’s terms, the sparser the network, such as one describing a population under lockdown, the slower the propagation and the flatter the epidemic peak.
This post is intended to be fairly non-technical. All experiments shown are based on numerical models and do not claim to accurately represent real-life epidemics. All the code (a small Python library and a few notebooks) and more detailed mathematical explanations can be found HERE.
Why stochastic models?
The use of randomness to simulate complex systems is ubiquitous in mathematics, engineering and sciences in general. The general principle is to build an engine to generate plausible scenarios for the evolution of the system and sample multiple independent realisations to study the average or extreme behaviours.
Before we move on to such models, let us briefly recall some standard deterministic models in epidemiology. These are called compartmental models, because they model the evolution of a patient as going through successive stages, or compartments. Three popular variants of this idea are :
-
Susceptible-Infected-Recovered (SIR) : all patients are initially susceptible, then can be infected, and then are removed from the system (either they are fully immune or they died),
-
Susceptible-Infected-Susceptible (SIS) : same but patients can be infected multiple times,
-
Susceptible-Exposed-Infectious-Recovered (SEIR) : similar to SIR, with an extra compartment to model incubation time, during which patient are not yet infectious.
Under mean-field assumptions, i.e every individual in a large population shares the same likelihood of being infected by the rest, one can derive a deterministic system of differential equations describing the evolution of the fraction of infected individuals (see for example Kephart & White).
While such models are easy to understand and scale very well, they lack any description of the fine structure of the underlying social network. For example, what if the network contains highly social individuals that may act as hubs for the propagation?
Markov models
A large class of popular stochastic models follow the Markov property : the future evolution depends only on the present state, not the past history. While debatable, it allows for very flexible still numerically tractable models.
Consider a network G, that is a list of individuals (for instance 1, …, N) and a list of pairs (i, j) if individuals i and j are neighbors. We will stick to this simple framework, but generalisation to weighted or directed networks is straightforward.
SIS, SIR and SEIR can be naturally translated to the language of Markov processes by specifying the probability of transition between compartments. As is customary with continuous-time processes, we will actually define the transition rates rather than the probability (the two are related by the fact that transition events follow exponential distributions with parameters equal to the transition rates).
For any individual, we assume a transition susceptible -> infected (or susceptible -> exposed in SEIR) at rate proportional to the number of infected neighbors. This is quite natural: the more one is surrounded by infectious people, the riskier (note that here again there is room for more complicated designs by using a nonlinear aggregation function over the neighbors). The other transitions, (I->S in SIS, I->R in SIR, E->I and I->R in SEIR) are assumed to occur at constant rates (think of it as sick people being put in isolation).
Experiments
SIR
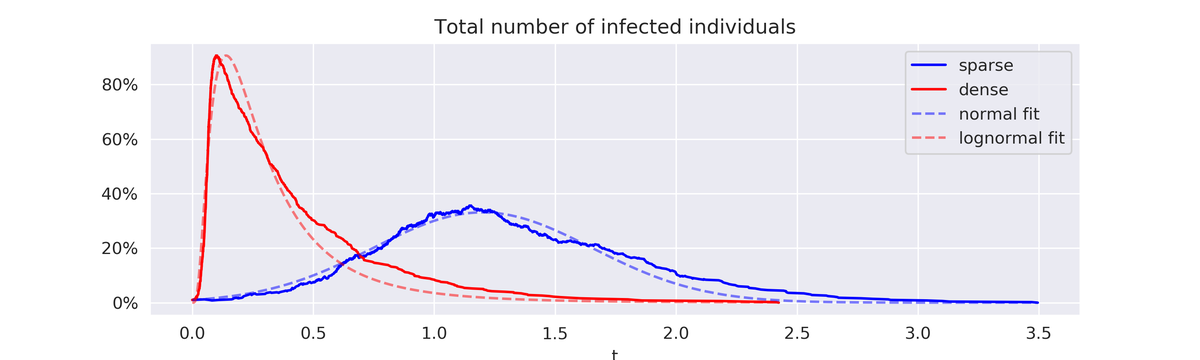
First let us simulate the effect of a severe lockdown in SIR. For that, we compare the evolution of the number of cases for the same epidemic (same transition rates parameters) on two different regular networks :
- sparse: every node is connected to 10 other nodes,
- dense: every node is connected to 100 other nodes.
In the sparse scenario, a typical outbreak has a long plateau and a slow decrease, but a much smaller peak. In the dense case, almost all the population gets infected at a very early stage, creating a sharp peak, followed by a brutal, but slower decrease. The blue curve below is a typical lockdown strategic goal (flat and slow) while the red curve is more inline with a herd immunity viewpoint.
To be a bit more quantitative about the shape of the curve, one can try to regress a parametric form on it. In all experiments, sparse SIR leads to an approximately normal form while dense SIR is better fitted by a skewed shape such as lognormal. In other words, network sparsification is not just about flattening the curve, but also controlling the slope.
Hub effect
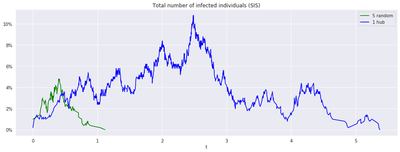
Another empirical effect is the Hub effect, which is that highly connected nodes are critical for propagation. This typically happens in social networks (a few very popular nodes attract most of the attention) and can be described as preferential attachment networks: starting from a small population of nodes, a larger network is grown by adding follower nodes that connect to the existing ones with probability proportional to the number of already existing neighbors.
In the case of SIS over a preferential attachment network, we compare two outbreak scenarios:
- a single patient zero, the one with the most neighbors,
- 5 patient zeros, drawn at random (and therefore likely to be follower nodes).
Unless a hub is targeted, the epidemic usually dies fast without reaching highly-connected zones, even with more initial patients.
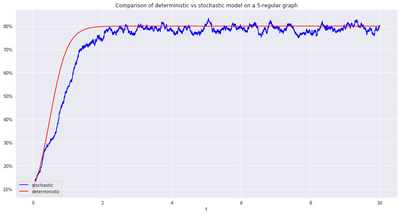
Comparison with deterministic models
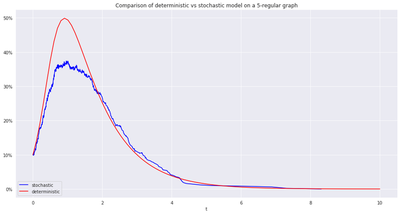
As argued above, deterministic models à la Kephart & White can be seen as scaling limits of Markov models on regular networks, i.e when the local structure of the network is the same everywhere one looks.
This is indeed empirically validated, see for example in the case of SIR and SIS below.
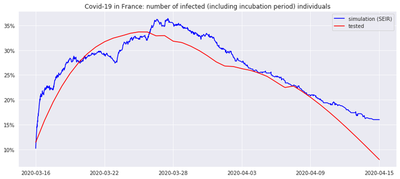
Comparison with real data (as of April 2020)
This is still a work-in-progress, made practically difficult by the number and quality of available data. One interesting direction would be to fit one of these models (for example SEIR) to the curve of tested cases of COVID-19 (which is typically noisy and subject to bias, including periodic bias, for instance during the week-ends when medical staff are not tested).
To be clear, calibrating the model here means tuning the transition rates for S->E, E->I and I->R such that the average curve over multiple epidemic scenarios resembles the most the collected data (for the example in the least squares sense).
From there, one could investigate different types of representative networks to determine the ones that reproduce the best the observed trends, and use this as a starting point for further predictions (epidemic evolution, impact of lockdown exit…).
Going further
A very attractive aspect of stochastic simulation is the ability to perform numerical experiments. However, the topic of random processes over networks has been studied a lot on the theoretical side as well. A few selected references include :
-
Virus Spreads in Networks by Van Mieghem et al., which formalises the definition of epidemic as a Markov process on the configuration space,
-
The Effect of Network Topology on the Spread of Epidemics by Massoulié et al., which exhibits a phase transition between short-lived and long-lived epidemics in terms of the transition rates and the adjacency spectral radius of the network,
-
Got the Flu (or Mumps)? Check the Eigenvalue! in the same spirit, which relates spectral properties of the network to critical epidemic regimes in different models.
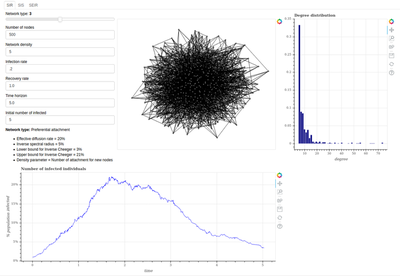
Also check out this repo for more implementation details, including a Bokeh app to dynamically play with different network and epidemic parameters.
Enjoy!
License
Copyright 2020-present Patrick Saux.